 Life, the Universe, and Software Engineering
NO CODE! Silverlight - SharePoint Integration
Tuesday June 2, 2009
Put together a Silverlight application to display SharePoint list data without using Visual Studio. A simple Silverlight library you can use in Microsoft Expression Blend to read SharePoint list data and display it in any Silverlight control. Even your mom can do it!
Well you would first have to teach your mom how to use Silverlight and XAML (Microsoft's extensble application markup language). But we are talking about a mom who can stop the DVD player from flashing 12:00 then aren't we?
If you have been following my series of articles on Silverlight-SharePoint integration (click here for Part I) you will notice that even though the amount of code needed to get data from SharePoint is not too complex, making it happen is not really for the faint-of-heart. In an effort to simplify the process I’ve come up will a neat little library that lets you link SharePoint list data to Silverlight controls directly in XAML.
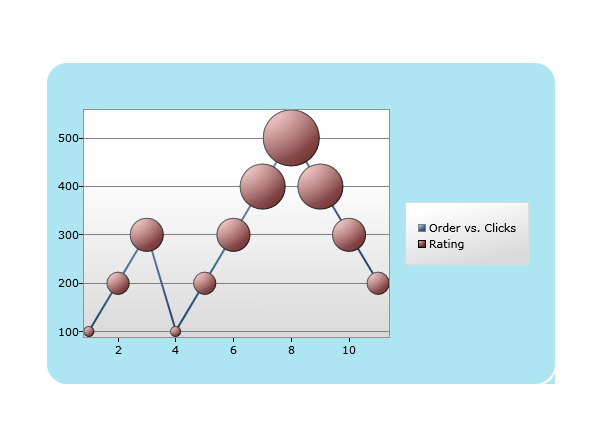
Since we don’t need to go into the gory details of code in this article let me jump right into the sample. Below is a screen shot of a simple graph of some SharePoint list data done in Silverlight:

This graph was created entirely in Microsoft Expression Blend 2. I use the chart control from CodePlex Silverlight Toolkit to create the actual graph. To get the SharePoint list data on to the chart control I first had to add a single xml line (highlighted in yellow) to the resources of my user control as follows:
|
<UserControl xmlns:x=http://schemas.microsoft.com/winfx/2006/xaml x:Class="SharePointListTest.Page" Width="640" Height="479" xmlns:spinterface="clr-namespace:DaisleyHarrison.SPInterface;assembly=DaisleyHarrison.SPInterface" … > <UserControl.Resources> … <spinterface:SPListDataSource x:Key="Links" SiteUrl="http://localhost/LinkList" ListName="Links" FieldNames="Clicks,ID,Rating,URLwMenu,Notes"/> … </UserControl.Resources> … </UserControl> |
Note the namespace reference to the Daisley-Harrison.SPInterface library in the UserControl tag. The magic is in the SPListDataSource tag. In this case the sharepoint site I want to read from is “http://localhost/LinkedList” the list the data will be coming from is “Links”, and I’ve named my SPListDataSource resource “Links”.
The XAML for the chart control is fairly straight forward, and I won’t be going into the details of how to use the chart control as the guys who created the toolkit did a great job explaining that here. The binding of the data to the chart control is done like this:
|
…. <chartingToolkit:Chart.Series> <chartingToolkit:LineSeries Title="Order vs. Clicks" ItemsSource="{StaticResource Links}" IndependentValuePath="NumericValue1" DependentValuePath="NumericValue0"/> <chartingToolkit:BubbleSeries ItemsSource="{StaticResource Links}" DependentValuePath="NumericValue0" IndependentValuePath="NumericValue1" SizeValuePath="NumericValue2" Title="Rating" IsSelectionEnabled="True" Background="#FF000000"/> </chartingToolkit:Chart.Series> </chartingToolkit:Chart …. |
There are actual two graphs being displayed on the chart. The first is a line graph, the second is a bubble graph. Each has it’s ItemsSource property bound to the SPListDataSource resource. The charting toolkit is a little fussy about the type of data it needs to create a data series with. The IndependentValuePath, DependentValuePath, SizeValuePath properties specify a string expression that is name of the property of the list item class to chart. The DependentValuePath must be a numeric value in order for the chart to work correctly. Since Silverlight binding expressions do not allow you to use an index like “MyFields[2]” the list items returned by SPListDataSource have a simplified way to access the first ten data fields.
- For numeric data types: NumericValue0, NumericValue1, NumericValue2, … NumericValue9.
- For boolean data types: BooleanValue0, BooleanValue1, BooleanValue2, … BooleanValue9.
- For any other object data types: Value0, Value1, Value2, … Value9.
Note that the order of the fields returned by the SPListDataSource is controlled by the order the fields are specified in the Fields property.
There is another way to access field data columns returned by the SPListDataSource. The library contains a value converter that can be used to access fields by name, and is not limited to the first ten fields. Unfortunately the value converter cannot be used by the charting tool, but most other Silverlight controls that take full advantage of binding expressions can use this method. For more information on using the value converter to access fields by name check out the details in the User Guide.
If you are attempting to debug silverlight applications on your laptop or desktop and the SharePoint server is not on the same machine (i.e. on a corporate server somewhere), you will need to prepare your SharePoint site first by placing a cross domain policy file on the root of the site, to allow the Silverlight application to access the SharePoint list web service (how SPInterface communicates with SharePoint). For details on how to do this please see Preparing your SharePoint site in the User Guide.
The full source “code” for the Expression Blend project used in this article is available here:
SharePointListTest.zip (1.63 mb)
The SPInterface library used in this article, along with a User Guide can be found at:
http://wiki.daisley-harrison.com/wiki/SPInterface.ashx